microVM
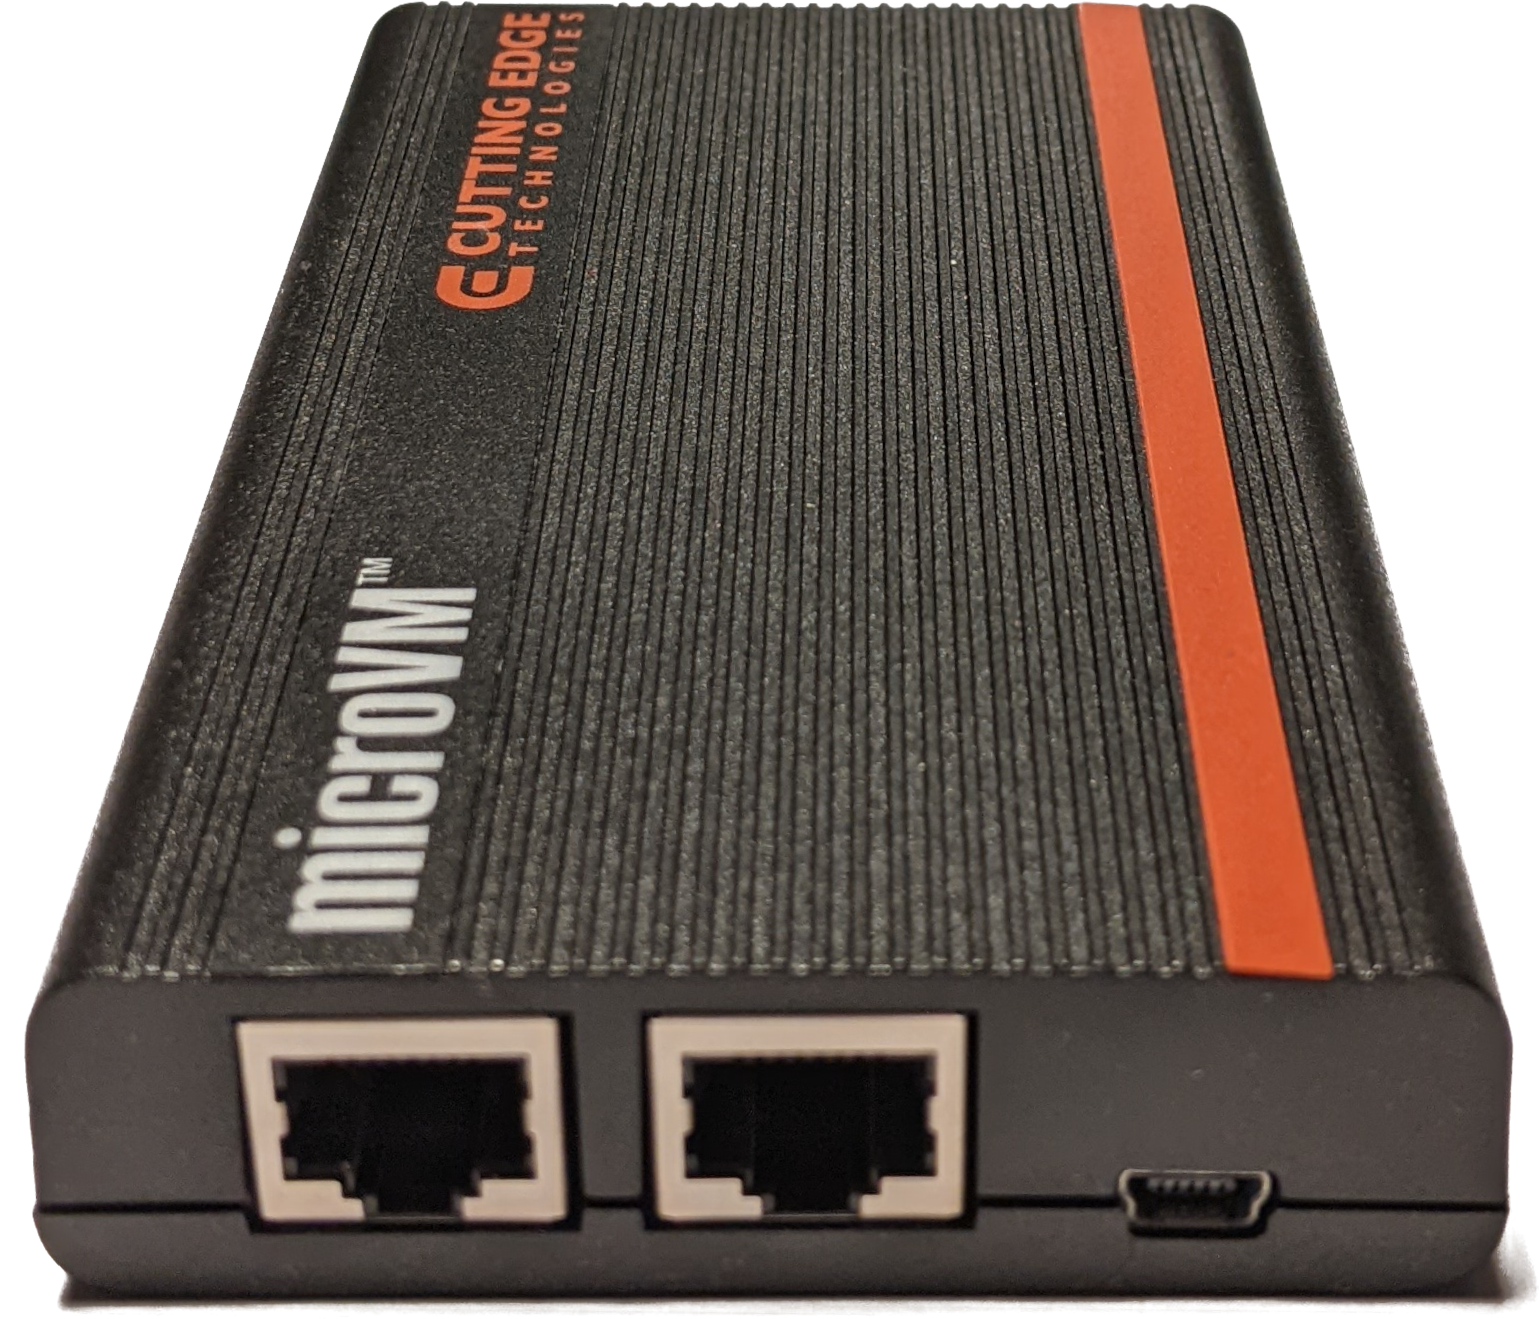
The microVM™ device is a breakthrough in both form-factor and functionality for real-time analysis of access network and customer home network performance. This unobtrusive device provides deep packet inspection and end-to-end visibility in broadcast quality media delivery over any IP based infrastructure. Combined with the Video Monitor Controller (VMC) server software, operators can now monitor 24/7 from head end to customer home.
Feature Highlights
Generally
- Passive mode: device will report traffic going through.
- Active mode: specify in VMC which multicasts to monitor.
- microVM can monitor thousands of multicasts by continuously zapping round-robin between the channels.
- Several multicasts can be monitored simultaneously.
- All multicasts are monitored including forward error correction (FEC/CoP3).
- Can be powered by a USB A plug or separate power supply.
- Remote automatic firmware upgrade.
- Ethernet ports work as a repeater and is transparent to any STB.
Measurements
microVM measures the following metrics (when available) every second and sends them to VMC for analysis.
- Bandwidth
- Inter-arrival time (IAT or jitter)
- Media loss rate (MLR or continuity errors)
- Real-time Transport Protocol drops (RTP)
- Join latency. Time taken from IGMP join is sent to the arrival of the first packet.
- Time to live (TTL)
- TOS/DSCP
- Destination IP and port, and source IP
- Stream destination IP and port, and source IP
- Type of stream (TS, RTP, FEC, generic data)
Home network monitoring
- So small you can mail it to subscribers in an envelope. Customer can install. Saves truck rolls.
- STB independent. Applications running on the STB can affect the measurements.
- Can be powered by the STB's USB A connector. No separate power supply is necessary.
- Plug and play: device automatically connects and reports to VMC.
Video Monitor Controller (VMC)
All data is sent to VMC where data is aggregated and devices can be centrally controlled and measurements analyzed. A single VMC supports thousands of devices. VMC can present collected data from different perspectives. This makes it easy to find if problems are isolated to a device, stream, server or geographical area. VMC is available as a cloud service or you can run your own server.
Click here to see a live demo of VMC.
Below is a selection of windows from VMC showing information from a device.
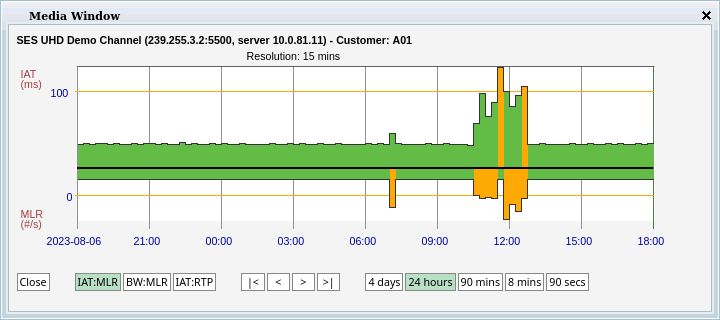
Media Window
This Media Window shows packet loss (under the baseline) and high jitter.
Each monitored stream can be inspected down to one second intervals.
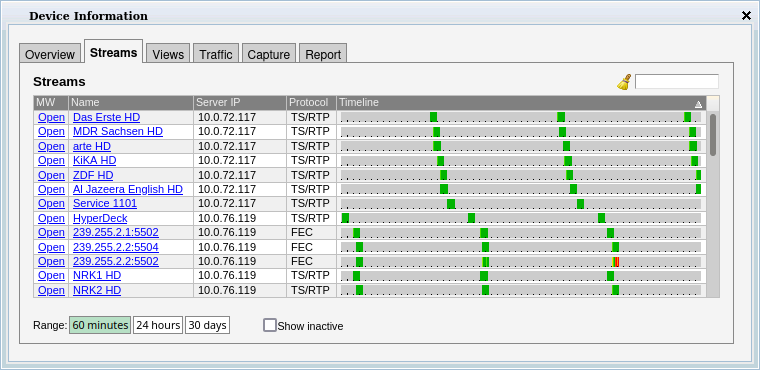
Streams
Streams show monitored streams. This microVM is zapping through the channels, three at a time.
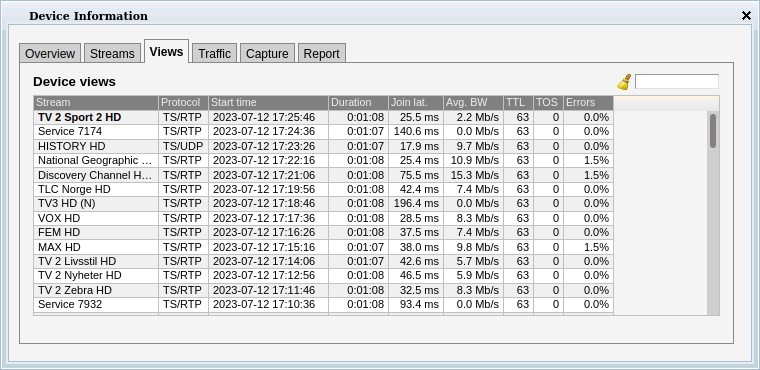
Views
Views tab shows a list of all streams the device has monitored.
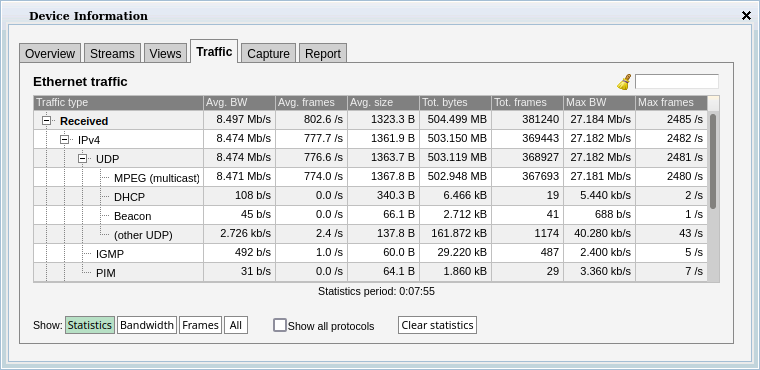
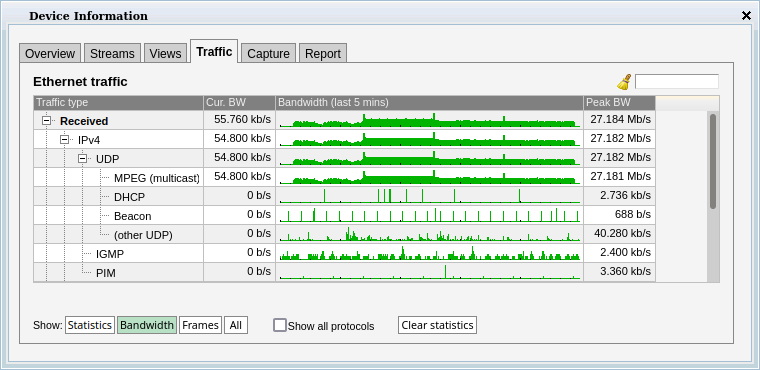
Traffic
Traffic view will show a breakdown of all packets going through the device.
Each packet is categorized into 28 different types. Extensive statistics is provided for each type.
VMC-as-a-Service (VMCaaS)
VMC is available as a cloud service. It is required that the microVMs are located so that they are able to send packets to the internet.Benefits with VMCaaS
- Map, traffic and report options included
- 30 day data retention
- 99.99% uptime guarantee
- Custom domain name with HTTPS certificate
- Automatic updates
- Support included
- Backups
- Help to get the most out of the system
- Most new features are automatically included in subscription
Technical
- Can be powered by standard USB port. MiniUSB cable is included.
- Devices communicate with VMC by sending crypted unicast UDP packets.
- Dimensions: 70 x 20 x 130 mm
- Weight: 107 g
- Power consumption: 2.5 W
- Status indicator LED
- Two 100Mb ethernet ports. Cable is included.
Pricing
| Item | Discount | Price |
|---|---|---|
| Single microVM | € 700 | |
| 5-pack microVM | 10% | € 3150 |
| 10-pack microVM | 20% | € 5600 |
| Shipping to Europe | € 15 | |
| Shipping outside Europe | € 30 |
New customers receive two months free VMCaaS.
Contact sales@cuttingedge.no.